Windows Kernel Debugging Walk Through
This is a quick walk through on the basics of Windows Kernel debugging. You will need two Windows Virtual Machines (VM) for this scenario. I used two Windows 11 25H2 VMs.
You can use which ever Hyper Visor you prefer. I used Hyper-V because it’s easy to use and allows you to run Virtualization Based Security (VBS) on your host and the VMs at the same time.
You can download the latest version of Windows installer ISO from Microsoft Download
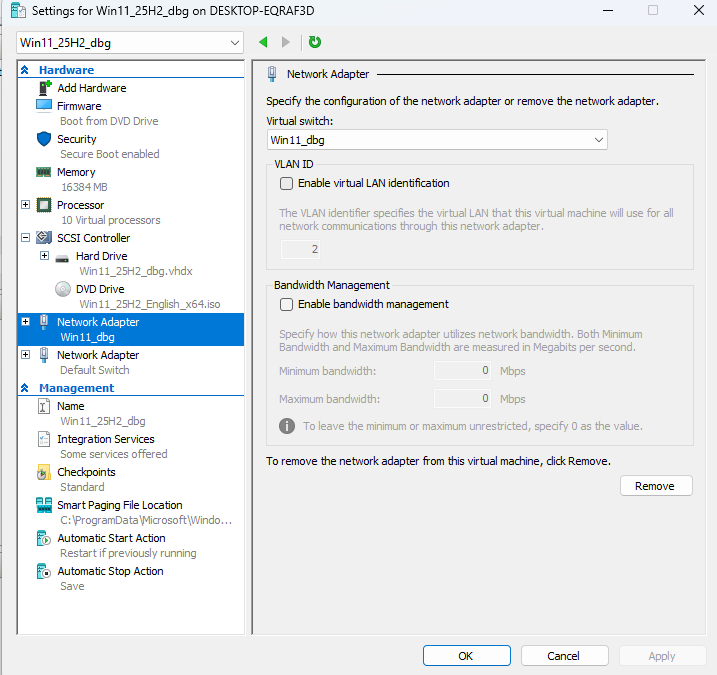
I recommend setting up two Network Interface Cards (NIC) per VM. One will be used for debugging the kernel and the other will be used for accessing the internet. If you want a completely isolated environment you could get by with one NIC. The debugging NIC must be the first NIC on the system.
This is a screenshot of my debugger VM settings showing the network setup. The debugging network is on it’s own private Virtual Switch.
It is important to ensure that Secure Boot is disabled on the Debugee machine. Secure Boot can be enabled on the Debugger machine.
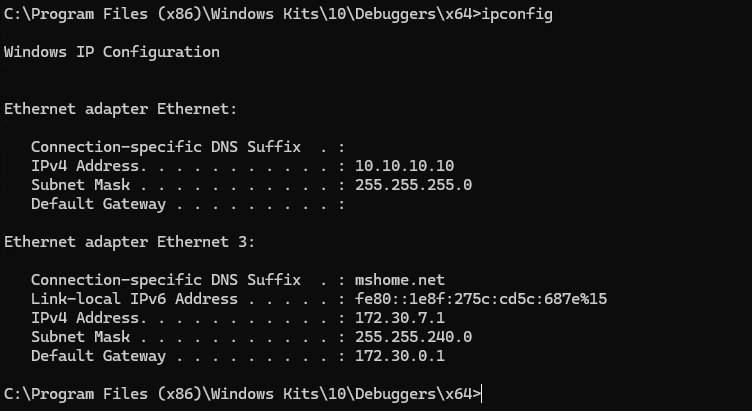
Set static IPs on the NIC assigned to the debug network. I used 10.10.10.10 for the Debugger machine and 10.10.10.11 for the Debugee machine.
The Debugger machine needs WinDbg installed. You can download it as part of the Windows Software Development Kit (SDK) downlaoded from Windows SDK or you can install WinDbg from a PowerShell terminal with:
winget install Microsoft.WinDbg
I also use the Debugger machine as my development platform and install Visual Studio Visual Studio Download and the Windows Driver Kit Windows Driver Kit Download. This is optional and not required if you are not doing any development.
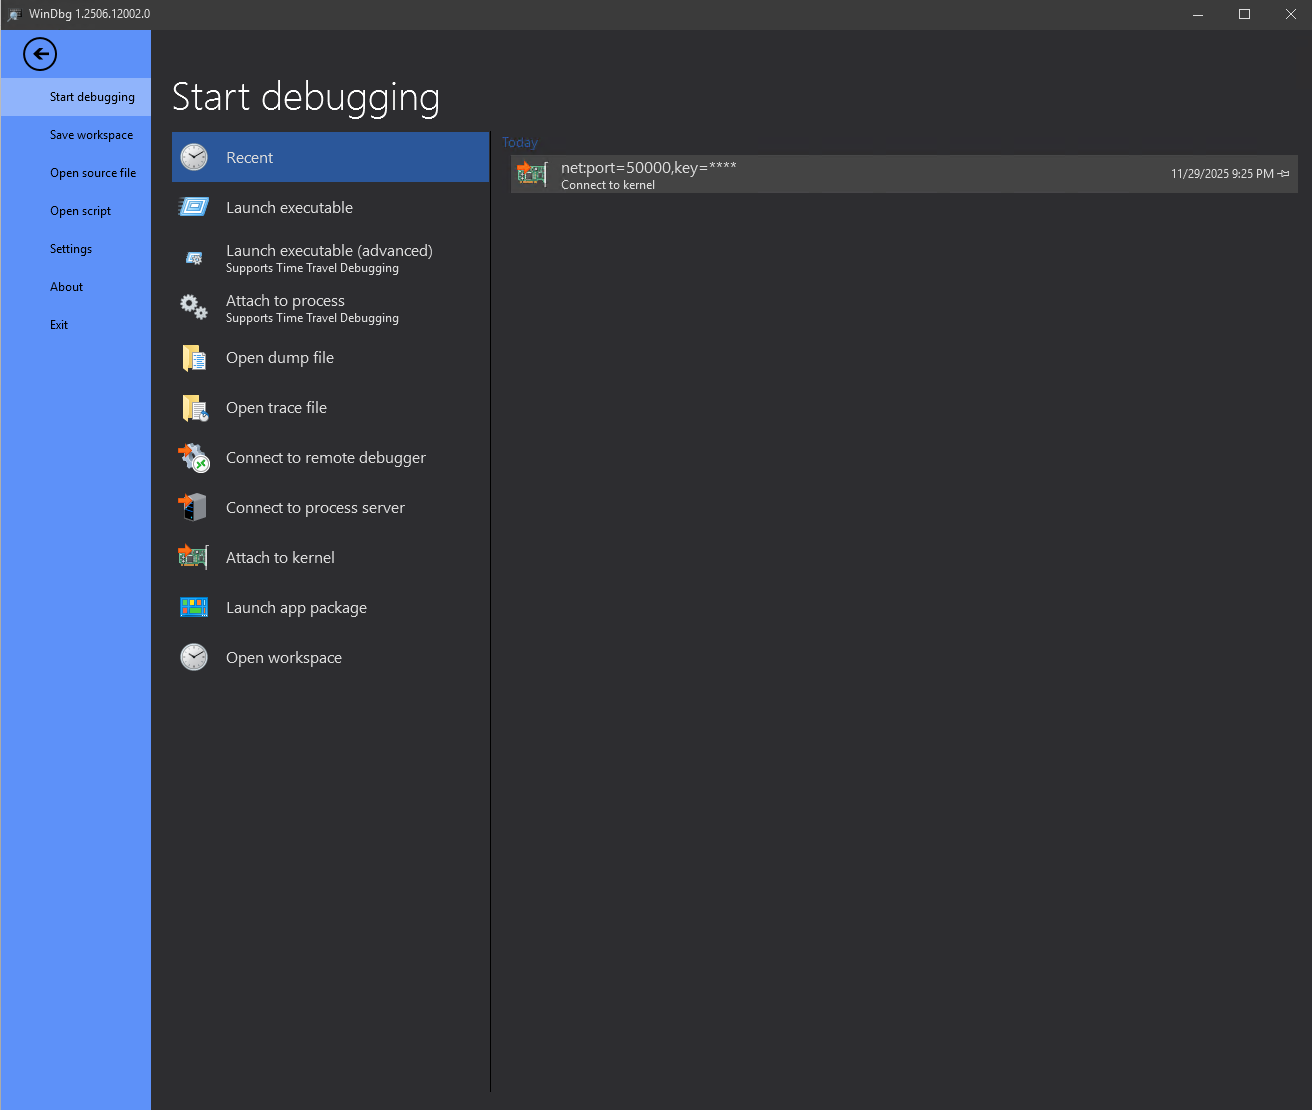
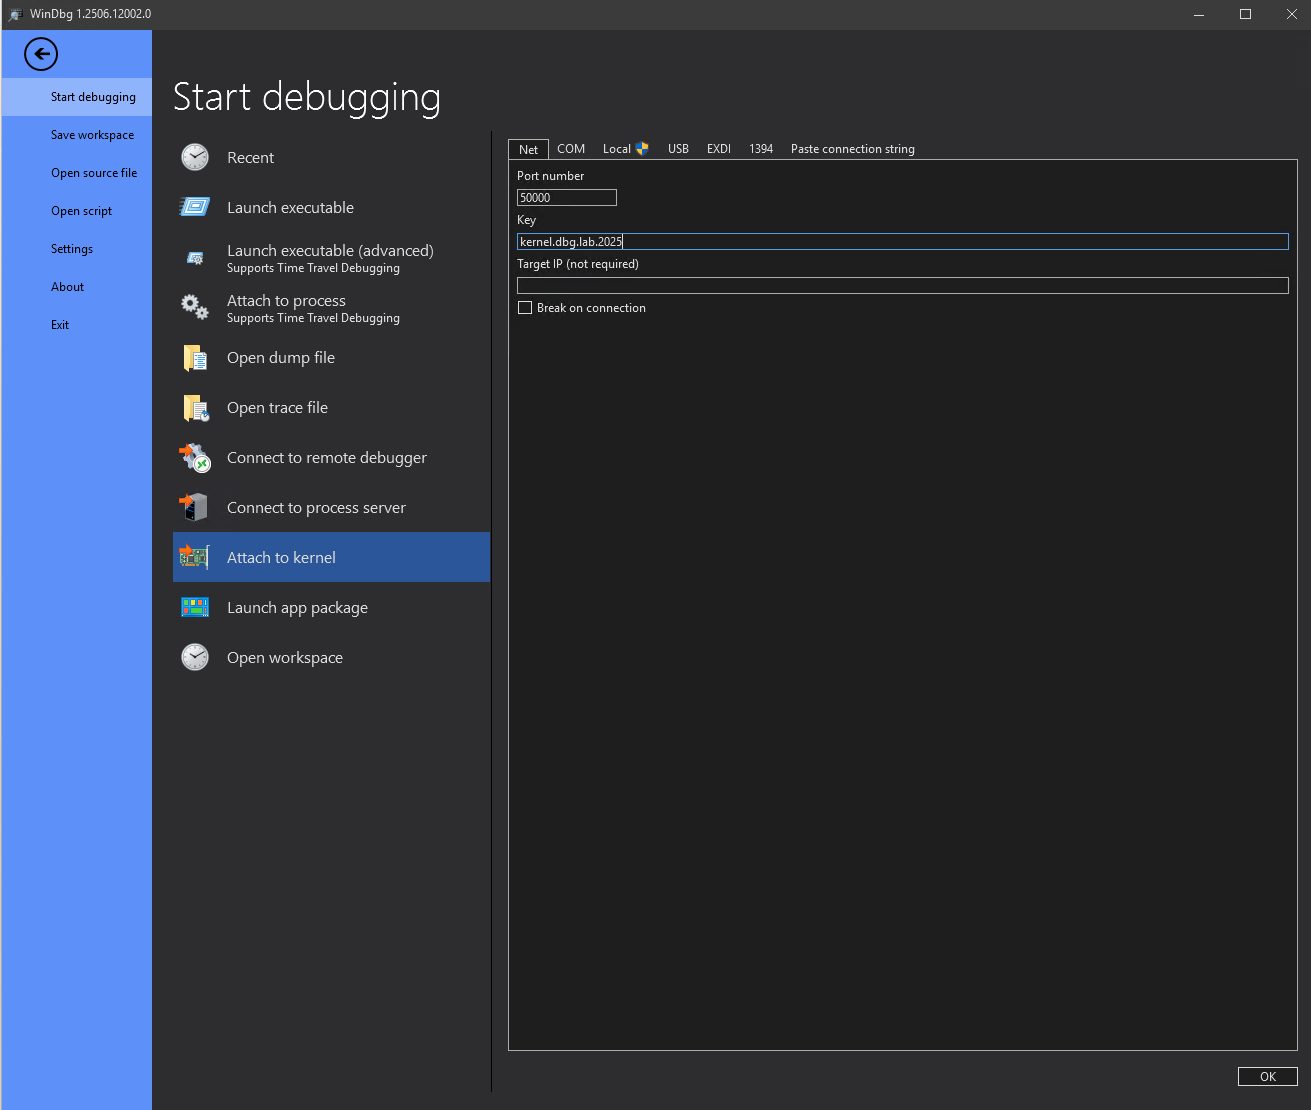
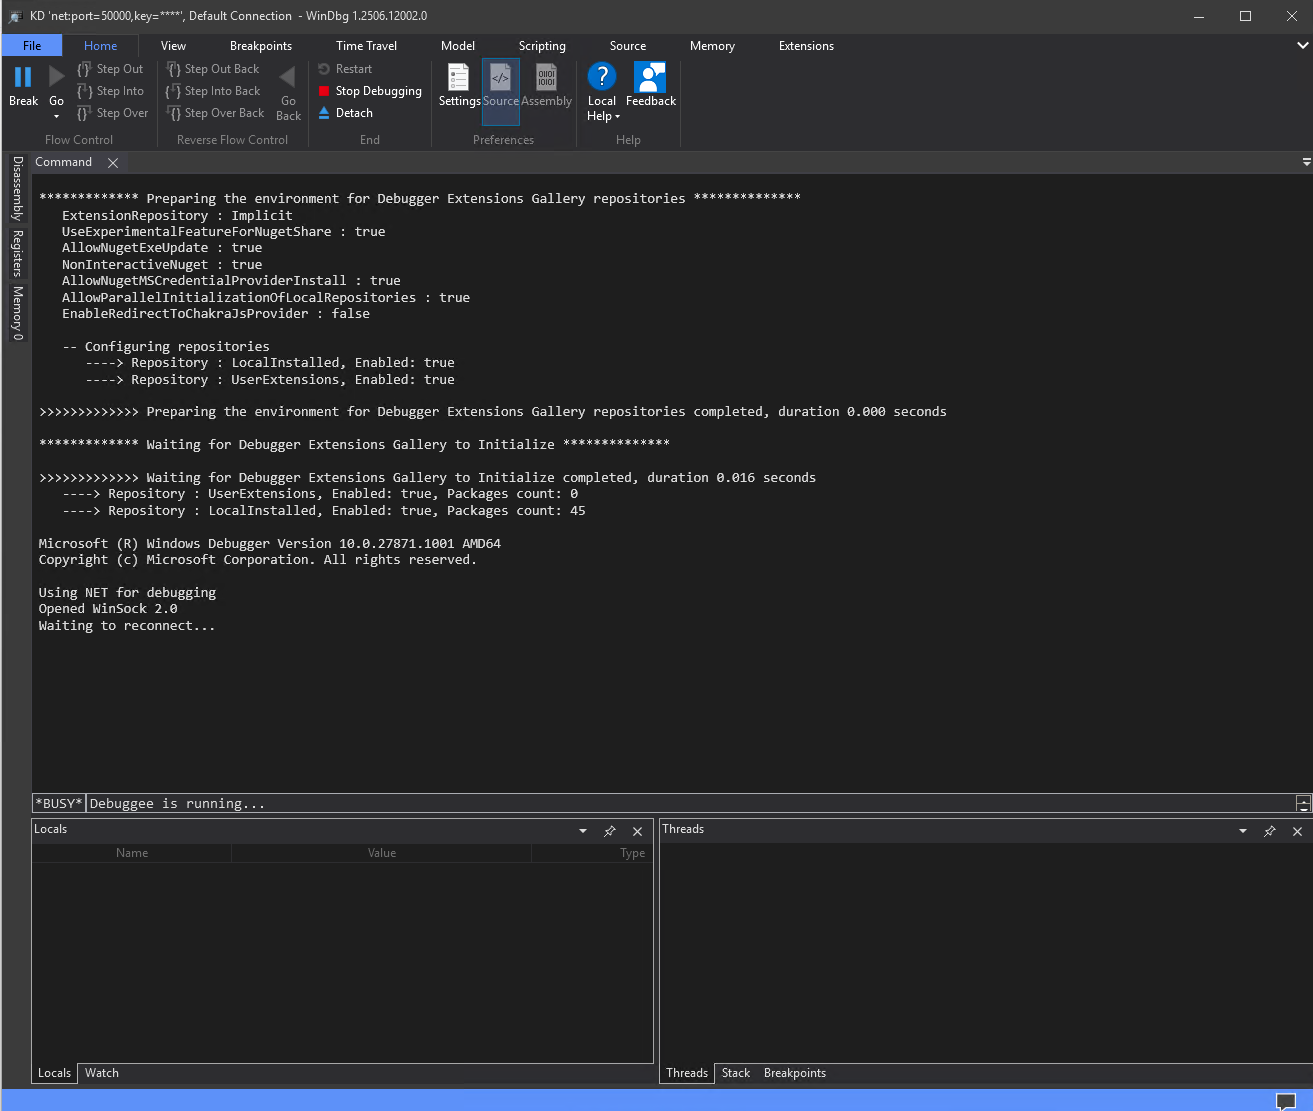
You can go ahead and start WinDbg and configure a Kernel Debugging connection listener by clicking File->Stat Debugging-> Attach to Kernel. Then set a port. You can use the default port 50000 or any other unused UDP port. You will also need a 256-bit authentication key that must be in the form of four 64-bit chunks separated by dots i.e. x.x.x.x. You can use lowercase a-z and 0-9 for each chunk. In my example I use kernel.dbg.lab.2025
You can pre-download symbols (function names, etc.) by opening a command prompt and creating a symbols folder and running the symchk tool. Kernel debugging will be a lot more confusing if you don’t have symbols. As long as you have internet connection on the Debugger machine you can download symbols on the fly, but it saves time when debugging to pre-download them.
mkdir symbols

cd "C:\Program Files (x86)\Windows Kits\10\Debuggers\x64"

symchk /r C:\Windows\System32\*.dll /s srv*C:\symbols*https://msdl.microsoft.com/download/symbols

symchk /r C:\Windows\System32\drivers\*.sys /s srv*C:\symbols*https://msdl.microsoft.com/download/symbols
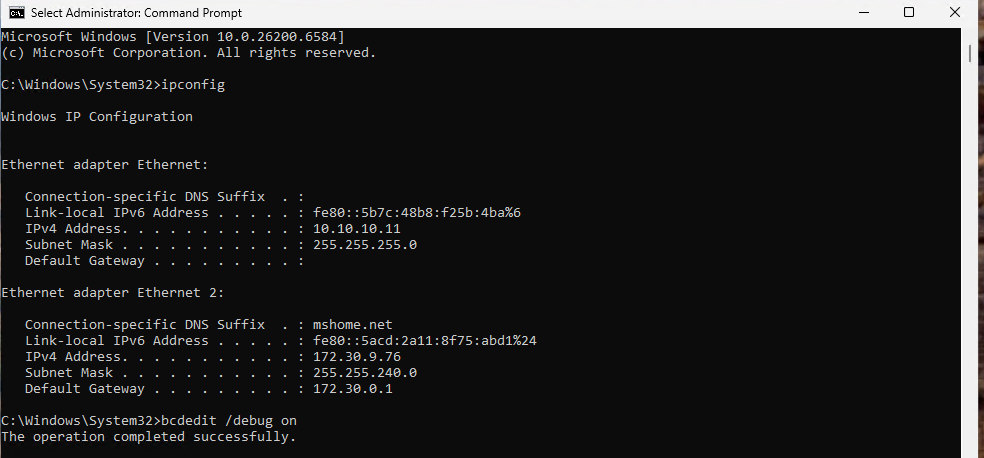
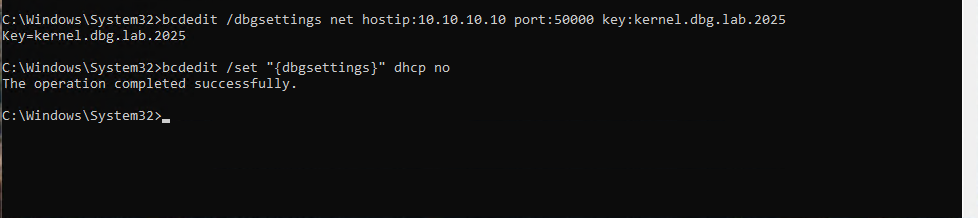
Now switch over to the Debugee machine to setup the IP information and configure kernel debugging. I used 10.10.10.11 for the Debugee IP on the debugging network. The following commands on an administrator command prompt will enable network kernel debugging to connect to 10.10.10.10 on UDP port 50000 with key kernel.dbg.lab.2025:
bcdedit /debug on

bcdedit /dbgsettings net hostip:10.10.10.10 port:50000 key:kernel.dbg.lab.2025

bcdedit /set "{dbgsettings} dhcp no"
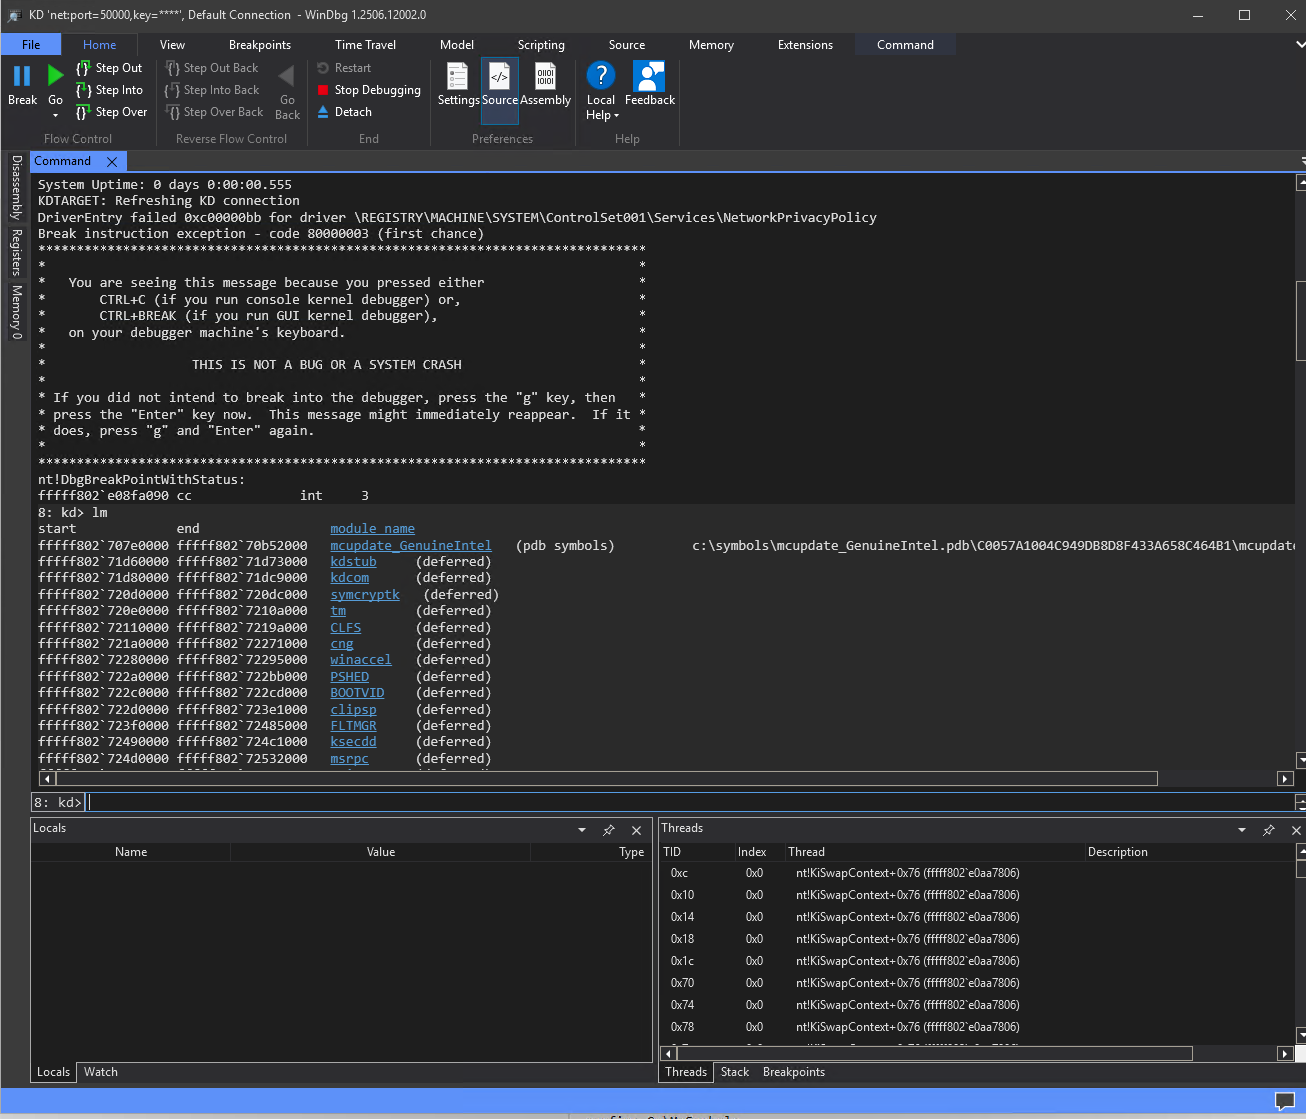
 Reboot the Debugee machine and you will see the connection on the Debugger machine.
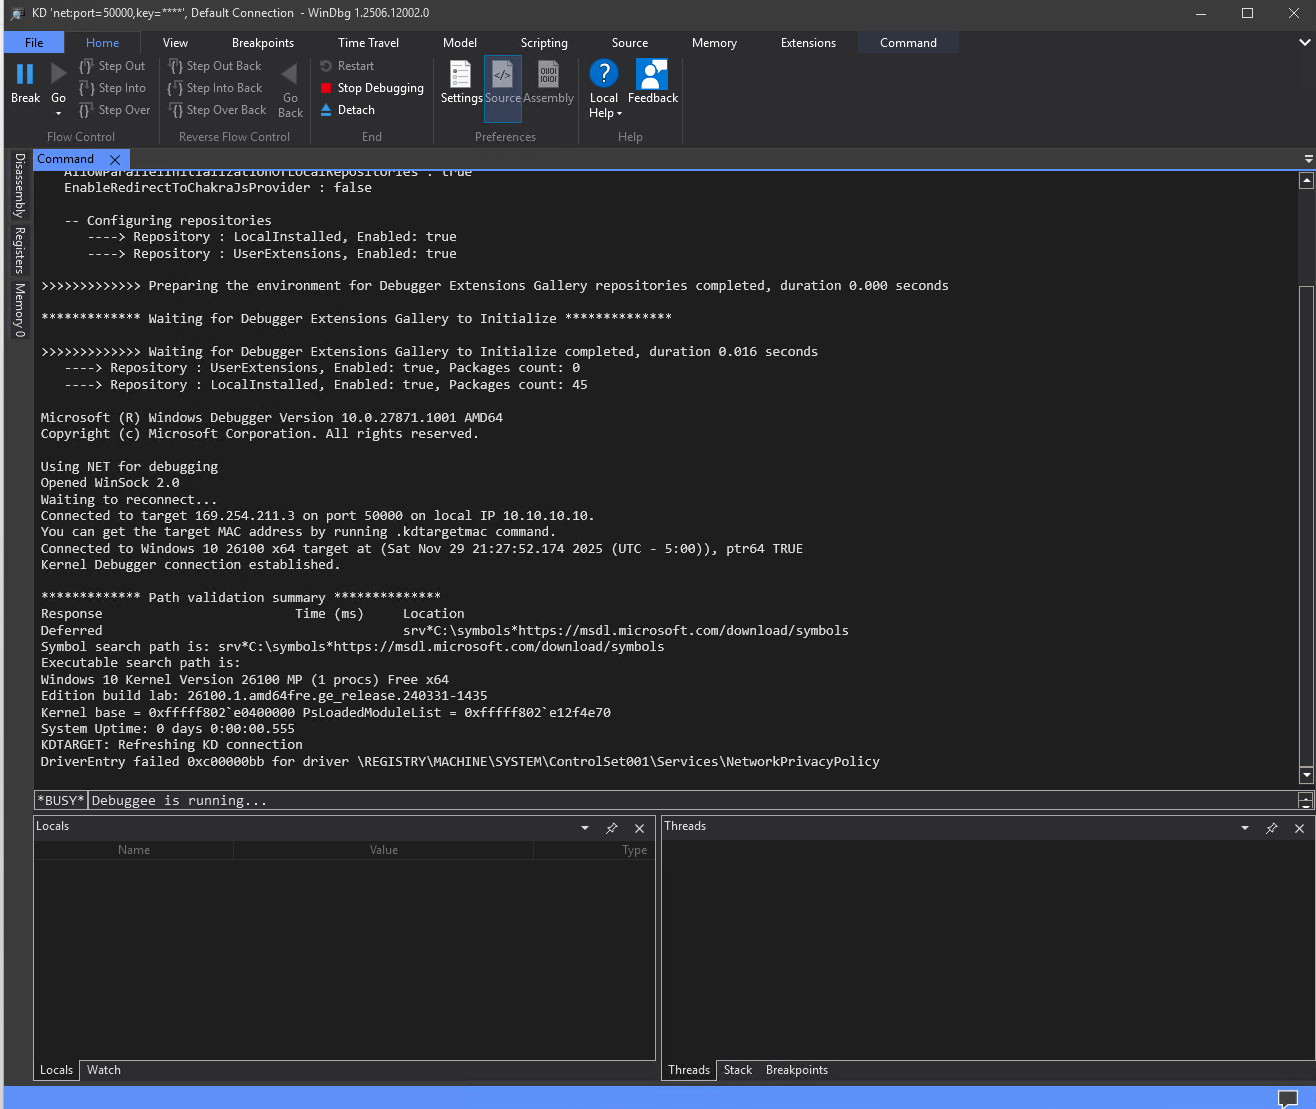 Click the pause button to break. This will cause the Debugee machine to become unresponsive to any input since you have initiated a break into the kernel. This happens anytime you hit a break point or manually break. Now is a good time to set your symbol path and force a reload of the symbols. The command bar changes from BUSY Debuggee is running… to 0:kd>. You will be able to type commands into the command bar and hit enter.
.sympath srv*C:\symbols*https://msdl.microsoft.com/download/symbols

.reload /f
 The .reload /f will force a reload of the symbols and attempt to download any missing symbols. Type g in the command bar and hit enter or click the green play button to resume the kernel and allow the Debugee to continue processing.
Here is a table of some of the useful WinDbg commands to use with kernel debugging:
| Command | Description |
|---|---|
dq address or register |
Display qwords at specified address or address in register |
dd address or register |
Display dwords at specified address or address in register |
db address or register |
Display byte at specified address or address in register |
dqs address or register |
Same as dq but also display symbols |
dds address or register |
Same as dd but also display symbols |
? expression |
Perform math operations |
u address or register |
Disassemble code at specified address or address in register |
.formats data |
Display the data in several different useful formats. Helps with converting hex to binary or decimal |
!process blank or 0 0 process_name |
Search for a process or display information about current process |
.process /i EPROCESS address |
Interact with the specified process |
bp address |
Set a breakpoint at specified address, you can use symbols instead of address |
bu address |
Set an unresolved breakpoint. Resolves once symbols are loaded |
ba e1 /p process address |
Set a hardware breakpoint on execution of a specified address from within a specified process. You can change e to r or w for read/write |
bl |
List breakpoints |
bc * or number |
Clear or delete all breakpoints or specified breakpoint by number retrieved with bl |
bd * or number |
Disable but not delete all breakpoints or specified breakpoint by number retrieved with bl |
.reload /f |
Force reload of symbols and download missing symbols |
!address address |
Display information about specified address |
!pte address |
Display the page table entry for the specified virtual address. Can also use with a PTE address to retrieve the associated virtual address |
lm blank or m module_name |
List loaded modules with base and end address or list only specified module |
!drvobj driver_name 2 |
List information about specified driver |
dt -v module!symbol |
Display table of a Windows data structure |
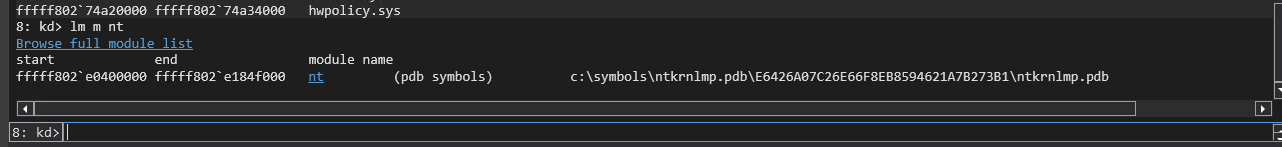
Here is an example of listing the currently loaded modules and then just the nt kernel itself:
lm m

lm m nt
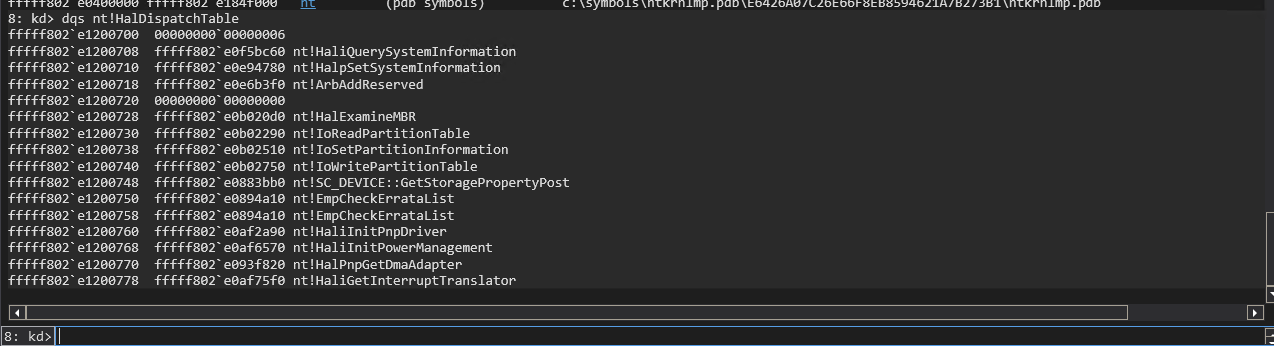
Here is an example of dumping the HalDispatchTable in the nt kernel using dqs:
dqs nt!HalDispatchTable
Start cmd.exe and launch calc.exe from the command prompt on the Debugee machine. You can then search for the calc.exe process, interact with it, and display it’s process info with:
!process 0 0 calc.exe

.process /i `EPROCESS address from above command`

g

!process
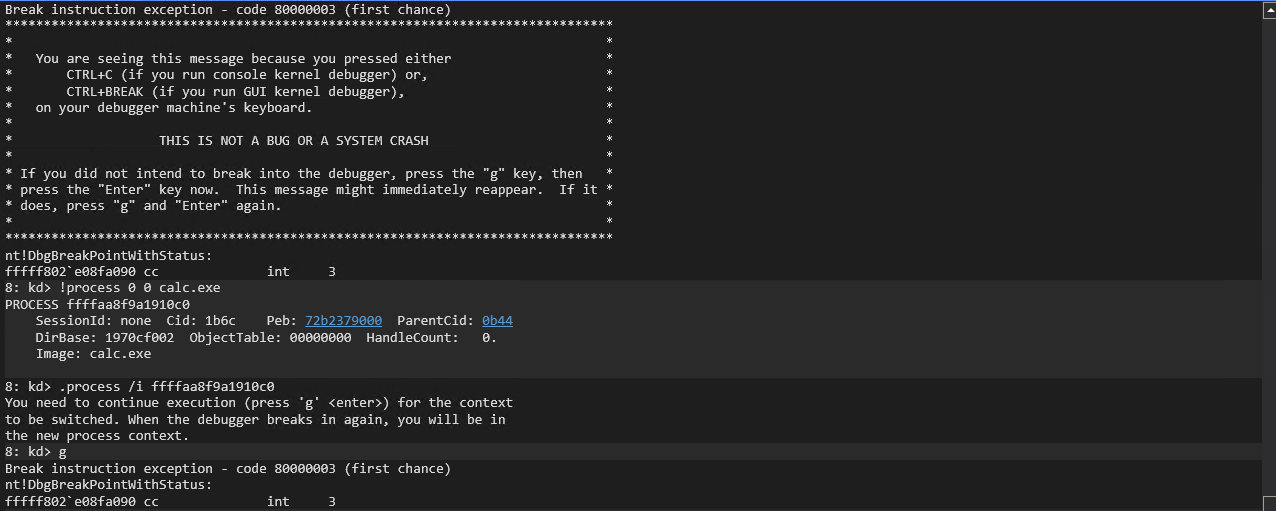
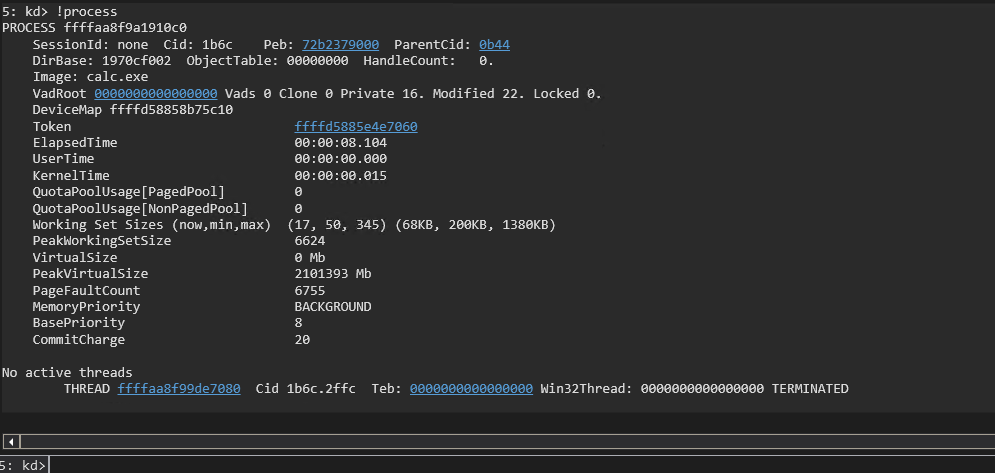 The address following THREAD in the above image is the address to the KTHREAD structure for the process. Process in Windows are a management and control mechanism for executing code. Processes do not execute code themselves. All code is executed under the process as a thread or fiber. When the process has multiple threads the one marked as ‘executive’ will have the KTHREAD. You can highlight the address and ctrl+c to copy the address and dump the KTHREAD with:
dt -v nt!_KTHREAD `kthread address`
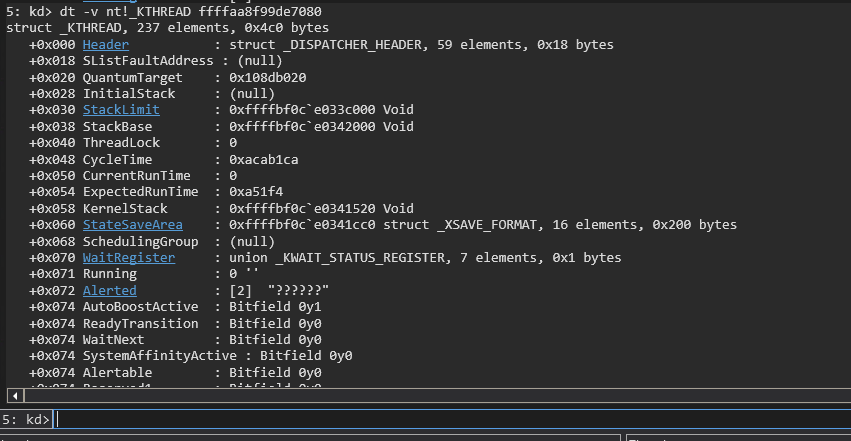
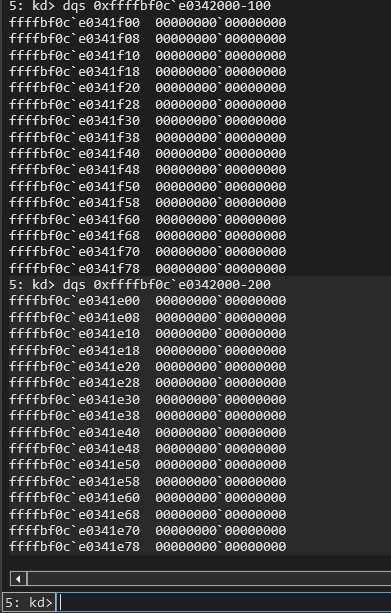
You can then take the StackBase, which is the address following the last address of the stack, and subtract from it to display the end of the stack. You can subtract 0x100 bytes and see a nice code cave no the Kernel Stack for the process with:
dqs `StackBase address`-100
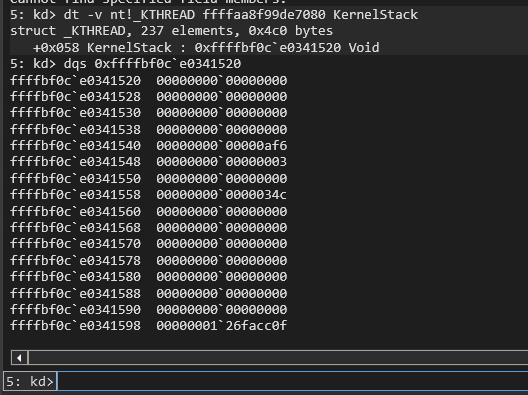
If you want to see where the Kernel Stack is currently point and what is on it you can use:
dt -v nt!_KTHREAD `KTHREAD address` KernelStack

dqs `address displayed from above command`
This was a quick run down on how to setup Windows Kernel Debugging and some quick familiarization on using WinDbg to help you get your bearings to follow along in future tutorials.
I highly recommend book marking the Vergilius Project to enumerate Windows Kernel Structures if you are going to be diving in to Windows Kernel Debugging Vergilius Project